Tai Van Ta, Harvard Law School
May 2007
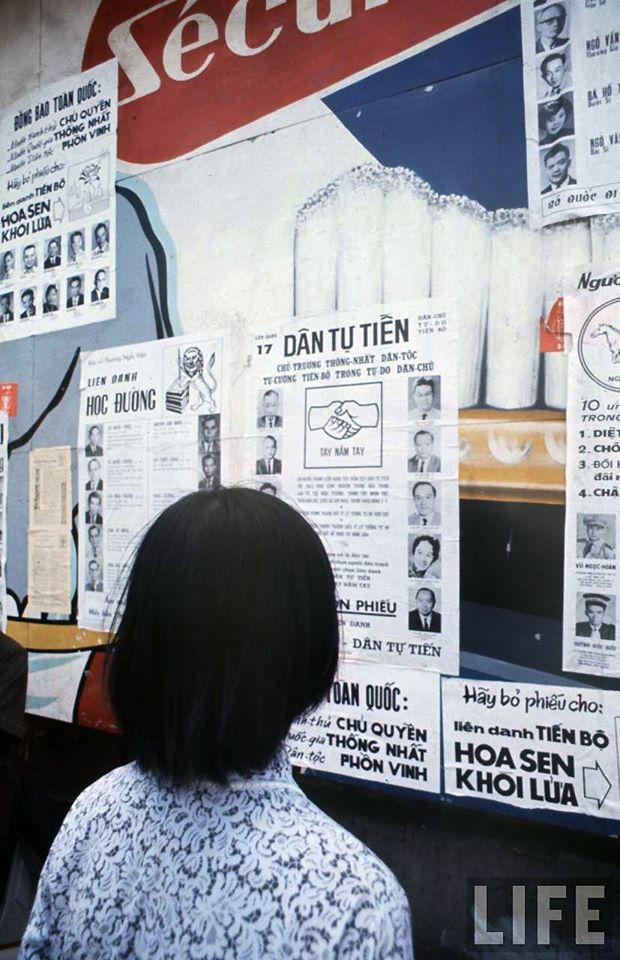
Democracy in action: The 1970 Senatorial elections in the Republic of Vietnam (Part 1, Part 2, Part 3, Part 4, Part 5)
ABSTRACT
Prefacing and ending with brief summaries of the political history of South Vietnam (1954-75), this paper focuses on the 1970 Senatorial elections, studied through a pre-election poll and an exit poll of 875 voters in the capital city of Saigon (probably the only political poll, during that period, conducted independently by a non-governmental group of researchers under the guidance of a professor of social science research methods). The analysis of the results of the polls show that (1) Even the population sample is not idealistically a stratified random sample of the whole nationwide population, the study can predict correctly the outcome with the three victorious slates of candidates, although with a slight difference in ranking.; (2) that the mass followings of the two dominant religious forces, the Catholics and the Buddhists, and their prominent personalities, were the factors in their slates’ respective victories, with the ‘third force’ Buddhists being the strongest political force in society and the number one victor in the elections, even they were anti-government and ran against a government-supported slate of candidates; this latter, even with the full force of government help, came second to the Buddhist slate, and the interviewed voters said they voted for the Buddhist slate because besides its religious (Buddhist) representativeness , the voters wanted peace represented by the Buddhists’ position; and that (3) the Buddhists were victorious despite the fact that they did not use so much the campaign means (interviews in the press, posters and banderoles) as the other slates, and despite that they were heavily criticized in many articles in the newspapers, but they fiercely condemned the government.
It is interesting to note that this free and fair election, encouraged by US Ambassador Bunker, was the climactic development of democracy in South Vietnam, which incipient democracy, unfortunately, was to be killed—even before the Communist troops overran South Vietnam in 1975–by President Nguyen Van Thieu just one year later, in 1971, when he ran a one-man show of presidential elections.
SECTION III. SOCIAL CATEGORIES OF THE ELECTORATE AS FACTORS IN VOTING BEHAVIOR
As stated above, the social categories we paid attention to in the survey were: Sex (male/female), age (classified into 4 groups: 18-30, 30-40, 41-50, and above 50), occupation, education level (primary school, high school, university), religion and party/group affiliation. Except for sex, which could be recorded without asking, and age, which could be asked or guessed by interviewers, the above remaining factors had to be elicited skillfully from the electorate, sometimes successfully, at other times not successfully, depending on the voters’ willingness for cooperation. Consequently, readers will see that for each slate, the total votes in all subcategories in a category–for example buddhists, catholics ,Cao Dai, Hoa Hao within the category of religion–might not be equal to the total number of votes the slate received, because voters would not reveal their religion. But on the whole, we were able to record the social categories of most voters. And therefore we can classify with reasonable reliability the votes according to the said social categories and can set forth a number of credible hypotheses on impact of social categories on voting behavior.
- Impact of sex and age.
In the sample of 875 persons, we had 502 males (57.3%) and 373 females (42.7%) and 332 persons in the 18-30 age group (38%), 240 in the 31-40 group (27.4%),211 in the 41-50 group (24.1%), and 92 in the age group above 50 (10.5%).
The interviewers’ choice of these social categories was not on a stratified sampling basis after knowing the exact percentages of sex and age in the population as revealed by an accurate census (there was no such accurate census), but it was a conscious effort to get as many different social categories as possible, and constant adjustment of their choices to reflect reality , when they went out to search for and meet voters.
Table 5. Sex and age and the voting behavior.
Voters in: MALE : FEMALE : AGE
: sample : 502 : 373 : : 18-30 : 31-40 : 41-50 : 51🡪 :
: 875 : (57.3%) : (42.7%) : 332 : 240 : 211 : 92 :
: (38%) : (27.4%):(24.1%): (10.5%)
TOTAL: DISTRIBUTION OF VOTES ACCORDING TO SOCIAL CATEGORIES VOTES
For:
1. N V Huyen, 336 : 218 : 118 : : 138 : 81 : 87 : 30 :
2. V V Mau, 309 : 186 : 123 : : 110 : 88 : 80 : 31 :
3. H V Cao, 115 : 80 : 35 : : 45 : 32 : 27 : 11 :
4. N C Hach, 107 : 63 : 44 : : 47 : 21 : 29 : 10 :
5. N P Dai, 90 : 32 : 58 : : 37 : 24 : 13 : 16 :
6. N N Huy, 74 : 46 : 28 : : 28 : 21 : 21 : 4 :
7. T V Le, 68 : 39 : 29 : : 21 : 25 : 13 : 9 :
8. T C Cuu, 57 : 35 : 22 : : 17 : 20 : 13 : 7 :
9. N H To, 56 : 31 : 25 : : 33 : 12 : 7 : 4 :
10. N D Bang 44 : 23 : 21 : : 16 : 10 : 12 : 6 :
11. N A Tuan, 42 : 27 : 15 : : 25 : 7 : 5 : 5 :
12. N G Hien, 39 : 30 : 9 : : 16 : 10 : 12 : 1 :
13. N T Hy, 31 : 21 : 10 : : 8 : 9 : 8 : 6 :
14. P B Cam, 23 : 21 : 12 : : 3 : 8 : 7 : 5 :
15. N V Canh, 12 : 5 : 7 : : 3 : 5 : 2 : 2 :
16. N V Lai, 9 : 4 : 5 : ; 2 : 3 : 1 : 3 :
No opinion yet 132 : 63 : 69 : : 35 : 35 : 42 : 20 :
Hiding opinion 27 : 19 : 8 : : 3 : 7 : 8 : 9 :
Not going to vote
Or will cast blank 59 : 40 : 19 : : 20 : 21 : 13 : 5 :
We have two observations from Table 5.
- The voters under 30 years of age were the largest group, those in other age groups are lesser and lesser in number, as we move to higher age groups. This percentage is typical of the pyramid of the population in developing countries. But this also showed that younger people were more politically conscious than older people. However, in general, age had little influence in terms of voters’choice of candidates of similar age. Young voters, in the 21-30 age group, still voted in large numbers for elder men of prestige such as N V Huyen and V V Mau. The cases of young voters voting for young candidates occurred in the cases of the slates of N H To (young military officers) and N A Tuan (young intellectuals): they received 5 times more votes from the age group 21-30 than from age groups 31-40 or 41-50.
- On the influence of sex, in the sample, the ratio of male to female voters was 57.3%/ 42.7% and most slates received more male votes than female votes. However, Mrs. N P Dai’s slate received twice as many female votes as votes from male voters. The women voters seemed to decide to vote for the representatives of their sex. This confirms the observation in section II above.
Moreover, more female voters than male had no opinion at the time of the interviews. This confirms the observation in Section II, about the influence of “father”, “husband”, “elder brother”, “eldest son”.
But twice or more male voters than female ones were among those who kept secret their opinion or decided not to participate in the voting or decided to cast a blank vote. Probably women seldom had a clear political opinion and seldom had a negative attitude or skepticism about politics.
- Impact of occupation and educational level.
We were able to collect data on the occupation for only 730 interviewees and on an educational level for 817 interviewees, among the sample of 875 persons. The method of work was ex-post facto or a posteriori control, i.e. we did not, because we could not, choose certain percentages of occupations or educational levels when we met people, because we did not have accurate census data, but we could only ask after interviewing people what their occupations or educational levels were and these facts were revealed only if the interviewees agreed to cooperate. Therefore, in Tables 6 and 7, we lacks complete occupation and education data on a number of voters. We simply hoped that with the good size sample of 875 people, we would cover almost all occupations and education levels, in the urban setting at least
- On the impact of voters’ occupations, we can look, in Table 6, at how the different occupations of 730 voters (in the sample of 875) voted for the slates of candidates
Table 6. Occupations and voting behavior.
VOTERS OCCUPATIONS (of 730 VOTERS)
IN SAMPLE : civil servants : traders : military : housewife : workers : liberal : clergy : farmers : teachers : business : police : taxi : cyclo : profession:
875 : 212(29%) : 202 : 115 : 102 : 70 : 25 : 2 : 2 :
: (27.7%): (15.8%) : (14%) : (9.6%) : ( 3.5%) : (0.2%) : (0.2%) :
TOTAL VOTES
FOR : DISTRIBUTION OF VOTES ACCORDING TO VOTERS’OCCUPATIONS
- N V Huyen, 336: 94 : 60 : 53 : 29 : 22 : 14 : 1 : — :
- V V Mau, 309: 76 : 61 : 32 : 35 : 25 : 13 : — : — :
- H V Cao, 115 : 27 : 23 : 23 : 6 : 7 : 5 : 1 : 2 :
- N C Hach, 107: 24 : 18 : 7 : 12 : 2 : 5 : — : — :
- N P Dai, 90: 23 : 18 : 6 : 12 : 11 : — : — : — :
- N N Huy, 74: 18 : 15 : 8 : 8 : 4 : — : — : — :
- TV Le 68: 14 : 20: 8 : 12 : 7 : 2 : — : — :
- T C Cuu, 57: 16 : 7 : 11 : 7 : 3 : — : — : — :
- N H To, 56: 7 : 8 : 22 : 4 : 1 : 2 : — : — :
- N D Bang, 44: 3 : 6 : 5 : 7 : 8 : 1 : — : — :
- N A Tuan, 42: 7 : 6 : 11 : 5 : 3 : — : — : — :
- N G Hien, 39: 15 : 7 : 4 : 2 : 6 : 2 : — : — :
- N T Hy, 31: 2 : 6 : 2 : 1 : 1 : 2 : 1 : — :
- P B Cam 23: 6 : 9 : 6 : 2 : 4 : 1 : — : 1 :
- N V Canh 12: 2 : 2 : 3 : 3 : — : — : — : 1 :
- N V Lai 9: 1 : 3 : 1 : 1 : 2 : — : — : — :
No opinion 132: 11 : 35 : 7 : 19 : 8 : 2 : — : — :
Hiding opinion 27: — : 4 : — : — : 1 : — : — : — :
Not going to vote
Or cast blank 59: 20 : 12 : 20 : 5 : 7 : 2 : 1 : — :
In general, we can say that voters’ occupations did not have much impact on their behavior. If we read the numbers in the columns of various occupations (civil servants and teachers, traders and businessmen, military and police, etc.) which we arrange in order of large to small numbers of persons of each occupation, we see that the votes received by each slate of candidates from the various occupations decreased in the same order. In other words, no particular slate was favored by any particular occupation.
However, certain particular cases need analysis. T V Le slate of candidates, which campaigned heavily among business people of Chinese descent, received a somewhat high percentage of votes from small traders and business people ( the slate received 20 or 32% of the total votes – while the percentage of traders and business people in the sample was 27.7%), especially if we compare with the votes from other occupations. The housewives, 14% of the voters in the sample, voted less for N V Huyen (only 29 votes or 8.5%) and H V Cao (only 6 votes or 5.2%) than their percentage number in the sample. But the clearest example of occupation impact is the military and police (15.8% of the sample) voted overwhelmingly (50 % or 22 votes among the 44 votes) for N H To slate (with the motto: “Peasants, workers and military vote for soldiers”). In the interview, the military clearly stated that “as soldiers, we vote for soldiers”.
If occupations did not, in general, have much impact on voters’ choice of candidates, they had a clear influence on the voters’ knowledge of contemporary political issues of the day and therefore on their participation/non-participation in the political process. Among the interviewees who said they “did not have an opinion yet”, we found comparatively many traders/business people (35) and housewives (19), more than in other occupations. But among those who said they were going to stay home on election day or would cast blank votes, we found comparatively many civil servants/teachers (20) and many military and police (20)—as if having been exposed to corrupt aspects of political life, they were skeptic and non-participating.
- On the impact of educational level on voting behavior, we can look, in Table 7, at how the 817 voters (among the sample of 875) belonging to different educational levels cast their votes for different slates of candidates.
Table 7. Educational levels and voting behavior
VOTERS IN : EDUCATIONAL LEVELS ( KNOWN FOR 817 INTERIEWEES)
SAMPLE : 875 : High school or “good level” : Elementary school : University
: 444 persons (or 54.4%) : 209 persons (or 25%) :164 persons (20%)
TOTAL VOTES
FOR SLATES :DISTRIBUTION OF VOTES ACCORDING TO EDUCATIONAL LEVELS
- N V Huyen, 336 : 136 : 54 : 79
- V V Mau 309 : 106 : 63 : 77
- H V Cao 115 : 36 : 21 : 35
- N C Hach 107 : 29 : 14 : 37
- N P Dai 90 : 38 : 16 : 14
- N N Huy 74 : 20 : 22 : 16
- T V Le 68 : 27 : 23 : 5
- T C Cuu 57 : 28 : 9 : 10
- N H To 56 : 26 : 10 : 3
- N D Bang 44 : 11 : 12 : 6
- N A Tuan 42 : 18 : 12 : 7
- N G Hien 39 : 14 : 14 : 7
- N T Hy 31 : 8 : 6 : 10
- P B Cam 23 : 5 : 9 : 1
- N V Canh 12 : 2 : 4 : 3
- N V Lai 9 : 2 : 4 : 2
No opinion yet 132 : 20 : 22 : 7
Hiding opinion 27 : — : 1 : —
Not going to vote or
will cast blank vote 59 : 26 : 17 : 18
In general, the slates of candidates received the numbers of votes from voters of high school, elementary school, and university education levels in the same proportion as the numbers of people of these levels: many from high school people, average from elementary school people, and few from university people. In other words, we find voters’ educational level to have no decisive impact on how they chose the candidates. But there were 4 leading slates in our sample which showed that education levels of voters could have some impact in terms of voting-getting in case the voters paid attention to the heads of the slates as scholars or teachers. University graduates were only 20% of the total voters in our sample, and yet, 37 of them voted for the slate of N C Hach, law school professor (or 46.2% of his supporters), 77 of them votes for the slate of V V Mau, also law school professor (or 31.3% of his supporters), 79 of them voted for the slate of N V Huyen, who was a famous attorney, and who had a famous teacher, former Prime Minister. Tran Van Huong, in his slate (or 32.6% of their supporters)
Similarly to occupation, the education level of the voters influenced the level of knowledge of current political events and therefore the participation/non-participation of the electorate. People with no opinion yet on the elections during the interview were more likely to be elementary and high school graduates (22 and 20) than university graduates (7 only)
- Impact of religion and party/group affiliation
We were able to get the data on religion for 832 persons in the survey sample of 875, but we could only record the party /group affiliation of 17 interviewees. Table 8 summarizes the findings on the impact of voters’ religion and party/group affiliation on their votes.
Table 8. Religion, party/group affiliation, and voting behavior
In this table, we classify and list the voters as follows: Religion of 832 voters in the first 5 columns (1) Buddhists, (2) Catholics and protestants,(3) Confucianists /ancestor worshippers,(4) CaoDaist,(5)Hoa Hao Buddhists, and then Party/group affiliation of 17 voters in the remaining 5 columns: (6) members of Buddhist youth and women associations, (7) Catholic students, (8) union members of General Confederation of Labor, (9) Viet Nam Quoc Dan Dang (Nationalist) Party, and (10) Cap Tien Party
VOTERS: 832 VOTERS’ RELIGION AND 17 VOTERS’ PARTY/GROUP AFFILIATION
IN SAMPLE: : (1) : (2) ; (3) ; (4) ; (5) ; (6) ; (7) ; (8) ; (9) ; (10) ;
875 : 557 voters: 197 : 69 : 5 : 4 : 4 : 3 : 7 : 2 : 1
: (70%) : (21.3%) : (8.4%) : (o.6%) : (0.4%) : (0.4%) : (0.34%) : (0.8%) : (0.2%) : (0.01%)
TOTAL VOTES :
FOR: DISTRIBUTION OF VOTES BY RELIGION AND GROUP/PARTY AFFILIATION
1.N V Huyen 336: 180 : 110 : 28 : 1 : 1 : 1 : 2 : 1 : 1 : —
2. V V Mau 309: 252: 30 : 16 : 2 : — : 2 : — : 2 : — : —
3. H V Cao 115: 41 : 61 : 5 : 2 : 4 : — : 1 : 4 : — : —
4.N C Hach 107: 78 : 14 : 8 : — : — : — : — : 1 : 1 : –
5. N P Dai 90: 57 : 18 : 8 : 2 : — : — : 1 : — : — : —
6. N N Huy 74: 52 : 8 : 8 : 1 : — : 1 : — : 1 : — :
7. T V Le 68: 35 : 23 : 5 : — : — : — : — : — : — : —
8. T C Cuu 57: 14 : 38 : 2 : 1 : — : — : 1 : — : — : —
9. N H To 56: 38 : 8 : 3 : — : — : — : — : — : — : —
10. N D Bang 44: 40 : 2 : 1 : 1 : — : 1 : — : — : — : —
11. N A Tuan 42: 27 : 7 : 5 : — : — : — : — : — : — : —
12. N G Hien 39: 10 : 28 : 1 : — : 1 : — : — : — : — : —
13. N T Hy 31 : 17 : 8 : 5 : 1 : — : — : 1 : — : — : —
14. P B Cam 23 : 16 : 2 : 1 : — : 2 : — : — : — : 1 : —
15. N V Canh 12: 6 : 2 : 3 : — : — : — : — : — : — : —
16. N V Lai 9: 7 : 1 : 1 : — : — : — : — : — : — : —
No opinion 132: 54 : 12 : — : — : — : — : — : — : — : —
Hiding opinion 27: 2 : 2 : 1 : — : — : — : — : — : — : —
Not voting or
blank vote 59: 50 : 11 : 11 : — : – : — : — : — : — : —
1. On the party/group affiliation, one may be surprised at the fact that very few voters revealed their party or group affiliation. It might be that some voters wanted to hide away their party or group affiliation and our interviewers did not make an extra effort to elicit it. But the more probable truth was most of the voters did not participate in any political party or group because Vietnamese parties and groups had not been successful in organizing masses of followers. In terms of vote-getting in Saigon and nationwide, probably only the Cap Tien Party, the slate of which was headed by Profesor Nguyen Ngoc Huy, had some mass following.
But once becoming a party or group member, a voter had the tendency to vote for his/her party or group and not for any other party or group, even though he/she had the right to vote for 3 slates of candidates. For example, V V Mau received 2 votes from Buddhist students and women associations, while N V Huyen and N N Huy only one vote .(for N N Huy, it was a vote from a student for “Professor Huy”). N V Huyen had 2 votes from Catholic students while V V Mau, representing the Buddhist force, got none from Catholic students. H V Cao had 4 votes from the Confederation of Labor (Tong Lien Doan Lao Cong), many more than other slates because the Confederation had pledged support for and actively campaigned for this slate. One Nationalist Party (Viet Nam Quoc Dan Dang) vote was for N C Hach. One Cap Tien vote was for N N Huy.
2. The impact of the voters’ religion was the strongest factor in the political alignment of the voters.. If we look at the 3 victorious slates, we can conclude that:
–The Buddhist voters gave the victory to the Hoa Sen (Lotus) Slate headed by Professor V V Mau, because among its 309 votes in our sample, the Buddhist votes were 252 or 81.5%. This slate had many Buddhist political leaders such as Bui Tuong Huan, Pham Dinh Ai, Tran Quang Thuan, etc. and was headed by the famous Professor Vu Van Mau, who shaved his head to protest Ngo Dinh Diem’s suppression of the Buddhists in 1963, while he was foreign minister of President Diem. It was actively supported by the monks, including monks Tri Quang (the charismatic monk and symbol of the Buddhist movement, who “shook America”, in the words of the Time Magazine cover in 1963 ) and Thien Minh (the great organizer of Buddhist political masses and moves), and Tri Thu. etc..
–As demonstrated by the sample, Catholic voters made victory possible for N V Huyen (with 110 Catholic votes of the total of 197 Catholic persons in the sample, or 56% of the total Catholic voters) and H V Cao (with 61 of the 115 votes or 53%).
–For other slates, voters’ religion also decided their behavior. N C Hach had the support of the Quoc Tu Buddhist followers (immigrating from North Vietnam in 1954) and gathered their votes concentrating in Districts 3 and 10 to the level 6 times higher than the Catholic votes for it (78/14). N N Huy had the support of Monk Thien Hoa, Chief of the Insitute of Propagation of the Dharma (Vien Hoa Dao) of the An Quang Buddhists and got 52 votes, while it obtained only 8 Catholic votes (but in Central Vietnam,, where the great masses of the An Quang Buddhists concentrated, the monks decided to support only one slate, the Lotus, of V V Mau and reneged on the promise to help also the Cap Tien slate of Professor N N Huy, to assure the Lotus slate’s victory—one decided that “everyone for himself” was better than helping others who then might secretly refrain from reciprocating the help and therefore might surpass one in votes and get elected while one would be left out on a limb ). There were only 4 Hoa Hao Buddhists in the sample and they all supported H V Cao (with Le Phuoc Sang as Hoa Hao representative) and two of them supported P B Cam (Dan Xa Party of the Hoa Hao Buddhists). On the influence of Cao Dai religion, T C Cuu slate came out victorious in Tay Ninh province because in the slate there was a former well-known province chief who was Cao Dai.
Comparing the voting behavior of Buddhists and Catholics, the latter had more discipline in voting behavior. The Catholics gave to N V Huyen 110 votes (56% of the Catholic votes) and to V V Mau only 30 votes (15% of the Catholic votes), and moreover, concentrated their votes for other slates with Catholic elements: H V Cao, T C Cuu, and N G Hien. The Buddhists gave 252 votes (or 44% Buddhist votes) to V V Mau—a not very high percentage—but gave 180 votes (or 32%) to N V Huyen, and spread their votes to other slates too.
— Once again, looking at the few victorious slates, we see that voters’ religion was only one factor and the prestige of the candidates or the support of the government was also important. We have to explain, for the case of N V Huyen, the higher number of Buddhist votes than Catholic votes by referring to the personal prestige of N V Huyen and former Prime Minister Tran Van Huong. Both Buddhist slates, V V Mau and N D Bang, were supported by the Buddhist clergy and population, but V V Mau received more votes than N D Bang (252 versus 40), because of the track record and prestige of the members of V V Mau’s Lotus slate. In reviewing the answers to the questionnaire, we found that many people voted for both V V Mau and N V Huyen and the reasons or considerations they adduced were the ability, past record, and personal prestige of the candidates. The above observation is not contradictory: Voters’ religion had only the effect of aligning the voters politically ( general suggestion to voters of one religion to vote for candidates of that religion), but the actual choice by voters of which slate among the many slates with the same religious tendency would be determined decisively by the personal prestige of the individual candidates (for example, voting for N V Huyen but not N G Hien; voting for V V Mau and not N D Bang)
— On the support of the government, H V Cao received few votes in the sample of Saigon voters, but its nationwide success made it electoral victor number 2, partly because of the Hoa Hao Buddhist factor, but especially because of the support of the government (one just has to check its votes in the provinces in the high plateau.). Slate number 16 was very weak in the capital of Saigon but scored as number 1, 2, or 3 in Pleiku, Phu Bon, and Darlac provinces because of the order of the government to support it.
— On non-participation, as revealed by the answers “ no opinion” or “not voting” or “blank vote”, Buddhists in Saigon were more inclined to non-participation than Catholics. But in Central Vietnam, the Buddhists went to the polls much more numerous than the Buddhists in the South.
* The author of this study thanks his students M.T.Cuong, N.V.Chinh, N.H.Duc, V.T.Dat, C.D.Phuc V.Tan, N.V.Tung, N.X.Thang, N.V.Trung, N.V.Vinh, N.H.Y, who helped to interview the voters, and his colleagues’ professors Diep Xuan Tan and Le Cong Truyen for analyzing part of the data, and especially professor Nguyen Van Bong, Chairman of the Association for Administrative Research who had encouraged and financed this project.
The author dedicates this study to the memory of the two leaders in the victorious Hoa Sen (Lotus) Slate of Candidates in the 1970 Senatorial Elections: The head of the slate, Professor Vu Van Mau, former Saigon Law School Dean and professor of the author, and later the author’s colleague in the same school, and Dr. Bui Tuong Huan, Saigon Law School professor and President of Hue University.
Democracy in action: The 1970 Senatorial elections in the Republic of Vietnam (Part 1, Part 2, Part 3, Part 4, Part 5)


 Vietnamese-America5 years ago
 ARCHIVES6 years ago
 Society & Culture6 years ago